Sales of all-electric EVs were up by 63%
16% of all new cars bought in the UK in March 2022 were fully electric. This is up from 8% of the market in March 2021. Both diesel and petrol share of the market has fallen in the last 12 months, from 72% of sales last March, to 58% now. This shows people are continuing to migrate away from the combustion engine and towards pure EVs. Sales of all-electric EVs were up by 63% year on year, whilst sales of hybrids were actually down by 2%.
Ciara Cook, Research and Policy Officer, said:
"Our latest car sales data shows that Brits are continuing to make the switch – electric car sales have doubled in the last year and is the fastest growing segment in the market.
We've also seen encouraging growth in certain areas of the country - 1 in 3 new car registrations in both Kent and Peterborough (inc. Cambridge) were fully electric.
Although it’s encouraging to see that diesel sales have halved in the past year, data shows that just under 19,000 were registered in March. This means these cars will be polluting the road for another 14 years before they’re scrapped. This, record prices at the pump, and 18% of the UK’s diesel coming from Russia, shows the government needs to continue its push for EVs to become mainstream.
We need the government to implement an ambitious Zero Emissions Vehicle mandate that will prioritise UK-based manufacturing, this will reduce upfront costs and increase the variety of models available to drivers."
The full data release is available here. You can view the data on our interactive dashboard, here.

UK market overview
Both diesel and petrol registrations are down from figures from last month and hybrid growth remains slow.

Regional highlights
For the third month in a row The Peterborough DVLA area (which includes Cambridgeshire), continues to be the leader in EV registrations. Maidstone (which includes all of Kent) comes in second with over 1 in every three new cars registered in both of these areas electric. Oxfordshire continues to fall down the list of EV hotspots now in third place.
We track regional registrations using a three-month rolling average, which masks big variations in EV market share from month to month. The DVLA areas and regions with the highest share of EVs are as follows:
Peterborough (inc. Cambridgeshire) - 40%
Maidstone (covering all of Kent) - 38%
Oxfordshire - 32%
Bristol - 23%
Birmingham - 22%
Refer to tables 4 & 5 for full regional statistics.
The race for EV market share
Tesla has dominated the EV market for the second time in a row with 1 in three EVs being from the manufacturer. In fact Tesla accounted for 5% of the new car market putting it amongst the largest volume marques in the UK this month. Behind Tesla the other manufacturers continue to battle it out with each marque currently having a much more even slice of the market.

For the full data, and year-on-year comparisons, refer to table 1 in the full release.
The brands who are quickest to electrify
The small volume manufacturers still top this table with Porsche and Jaguar making bold strides to electrify their fleet. Of the high volume manufacturers, 1 in four Fiat’s were electric, showing very strong growth from not being in the top ten six months ago, to coming in third this month.
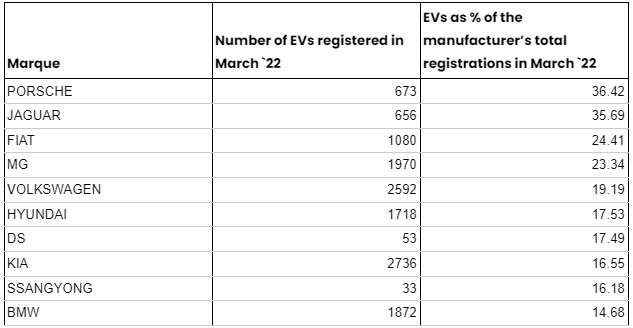
We exclude brands that are 100% electric from this table since they do not need to electrify their sales. For the full data, refer to table 2 in the full release.
Notes
About Electric Car Count
Electric Car Count is a monthly data series from New AutoMotive, a not-for-profit independent transport research organisation with a mission to accelerate and support the UK’s transition to electric vehicles. You can find out more about New AutoMotive by visiting www.newautomotive.org/mission
Electric Car Count provides an overview of the newly licensed passenger cars. It is released monthly, in the first few days of each month, providing data on the previous month’s newly licensed cars. In the UK, vehicles must be licensed (also known as registered) to be legally driven on UK roads.
We provide an overview of the state of the market, showing the number of cars registered by each manufacturer, broken down by fuel type. This provides a new way to track the transition to EVs in the UK.
Visit our interactive data dashboard here: www.newautomotive.org/ecc
For more background information on the statistics we provide, you can read our blog about the race for EV market share: www.newautomotive.org/blog/the-race-for-ev-market-share-is-under-way
Data sources & methodology
The data is shows the number of type M1 vehicles (i.e. passenger cars) in the DVLA’s vehicle licensing database as it stands on, or shortly after, the 1st day of the month. The DVLA’s vehicle licensing database is the legal record of all vehicles licensed for use in the UK. We obtain the data from the DVLA’s vehicle enquiry service API, and the DVSA’s MOT history API.
The data covers all cars with a standard form UK vehicle registration mark (VRM, i.e. the vehicle’s number plate), but does not capture any vehicles with personalised VRMs.
Terminology
We use the following terms to refer to vehicle fuel types:
Pure electric: battery electric, or other purely electric-powered vehicles (such as hydrogen). These are vehicles where the drivetrain of the vehicle is only electric, with no facility to drive using a fossil fuelled engine.
Hybrid: vehicles that have the ability to drive under electric power or under fossil fuel power. These include vehicles classified by the DVLA as “hybrid electric”, “electric diesel”, for example.
Q&A
Why are the numbers different from other organisations, such as the SMMT?
Our numbers are typically slightly different from those published by the SMMT. We cannot speculate as to why this is because the SMMT do not publish the methodology for obtaining their vehicle data.
Our data is based on the DVLA’s legal record of vehicles licensed as it stands on the first of the month.
Our methodology does not capture newly registered vehicles with a personalised number plate. These take longer to appear in our database, and are not included in the monthly release. We do not believe that these are a statistically significant part of the market.
Will you make this data open and accessible to more organisations?
Yes, we are happy to supply the data to anyone where doing so will not conflict with our mission. We encourage people to reach out to us on data@newautomotive.org.