30% jump in EV sales, but why?
Twice as many people bought electric cars as bought diesels in September, according to new figures from Electric Car Count, which tracks new car registrations in the UK. September’s new car registration data showed a 30% jump in electric car sales while other fuel types all suffered declining or stagnating sales figures.
Ben Nelmes, Head of Policy and Research at New AutoMotive, said:
“September is often a bumper month for EV sales, but even these statistics surprised us. Twice as many people bought electric cars as bought diesel cars, showing the ongoing slump in sales of polluting diesels.
“In many UK cities - Newcastle, Bristol, London, Oxford, Cambridge and Birmingham, the figures suggest that 1 in 5 cars bought are fully electric. That is good news for the millions of people living in areas with illegally high levels of air pollution.
“Our data show that the market for EVs is incredibly diverse, with a growing number of brands and models bringing electric cars to market. Among the brands that are fastest to electrify, Jaguar tops the table for the third month in a row - a British success story that we can all celebrate.”

The full data release is available here. You can view the data on our interactive dashboard, here.
UK market overview
Sales of conventional fuel types slumped in September 2021 while EV sales jumped. Petrol registrations were down by almost half from 189,700 in September 2020 to 99,900 in September 2021. New diesel registrations slumped from 51,700 to 14,600. The number of new hybrids bought stayed static at 50,000. The only segment of the market that experienced growth was fully electric cars, which grew by 30% from 20,800 to 29,600 year on year.
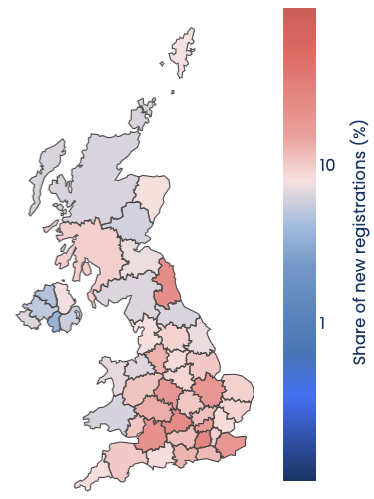
Regional highlights
Several areas of the UK have experienced rapid growth in EV sales in recent months.
In Newcastle, 23.35% of new cars bought in September were fully electric, making it the city where EVs are the most popular in the UK. Bristol and London are a close second, and across the UK there are now several locations where EVs make up 1 in 5 new car registrations.
Oxfordshire - 24.61%
Newcastle - 23.35%
Bristol - 21.46%
London - 20.87%
Kent - 19.45%
Peterborough & Cambridgeshire (“Anglia-Peterborough DVLA area”) 19.27%
Birmingham - 19.05%
We present regional data on a three-month rolling average to account for irregular vehicle supply patterns.
Refer to tables 4 & 5 for full regional statistics.
The race for EV market share
One of the reasons for September’s bumper EV numbers is that it is a month where Tesla makes a lot of deliveries (typically this happens in four months of the year). Their 21% share of the market is impressive, but masks the fact that for many months of the year, they make far fewer or no deliveries. Beyond Tesla, VW leads the race for EV market share with almost 9% of the market, but the low market share numbers for every manufacturer shows how many brands are piling into the market and racing to electrify their models.

For the full data, and year-on-year comparisons, refer to table 1 in the full release.
The manufacturers who are quickest to electrify
For at least the third month in a row, Jaguar has topped the league table of brands measured by the percentage of their new registrations that are fully electric. JLR has a target to electrify the Jaguar brand by 2025, and seem to be well on the way to achieving it. Beneath the top then, it is interesting to see that Ford has gone from 0% of its sales being fully electric last year - it had no electric models on offer in the UK - to 8% of its new car sales being electric this year. Mercedes-Benz, too, has gone from 1.45% of sales being fully electric to 22% in a year.
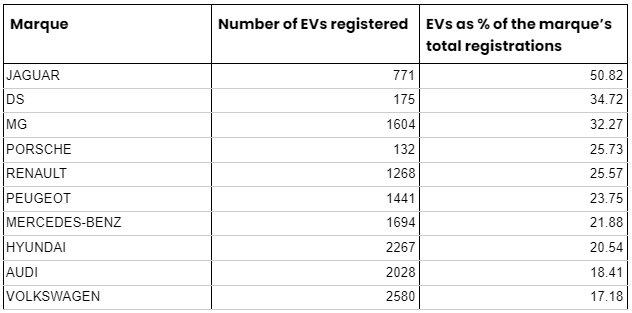
For the full data, refer to table 2 in the full release.
Notes
About Electric Car Count
Electric Car Count is a monthly data series from New AutoMotive, a not-for-profit independent transport research organisation with a mission to accelerate and support the UK’s transition to electric vehicles. You can find out more about New AutoMotive by visiting www.newautomotive.org/mission
Electric Car Count provides an overview of the newly licensed passenger cars. It is released monthly, in the first few days of each month, providing data on the previous month’s newly licensed cars. In the UK, vehicles must be licensed (also known as registered) to be legally driven on UK roads.
We provide an overview of the state of the market, showing the number of cars registered by each manufacturer, broken down by fuel type. This provides a new way to track the transition to EVs in the UK.
Visit our interactive data dashboard here: www.newautomotive.org/ecc
For more background information on the statistics we provide, you can read our blog about the race for EV market share: www.newautomotive.org/blog/the-race-for-ev-market-share-is-under-way
Data sources & methodology
The data shows the number of type M1 vehicles (i.e. passenger cars) in the DVLA’s vehicle licensing database as it stands on, or shortly after, the 1st day of the month. The DVLA’s vehicle licensing database is the legal record of all vehicles licensed for use in the UK. We obtain the data from the DVLA’s vehicle enquiry service API, and the DVSA’s MOT history API.
The data covers all cars with a standard form UK vehicle registration mark (VRM, i.e. the vehicle’s number plate), but does not capture any vehicles with personalised VRMs.
Terminology
We use the following terms to refer to vehicle fuel types:
Pure electric: battery electric, or other purely electric-powered vehicles (such as hydrogen). These are vehicles where the drivetrain of the vehicle is only electric, with no facility to drive using a fossil fuelled engine.
Hybrid: vehicles that have the ability to drive under electric power or under fossil fuel power. These include vehicles classified by the DVLA as “hybrid electric”, “electric diesel”, for example.
Q&A
Why are the numbers different from other organisations, such as the SMMT?
Our numbers are typically slightly different from those published by the SMMT. We cannot speculate as to why this is because the SMMT do not publish the methodology for obtaining their vehicle data.
Our data is based on the DVLA’s legal record of vehicles licensed as it stands on the first of the month.
Our methodology does not capture newly registered vehicles with a personalised number plate. These take longer to appear in our database, and are not included in the monthly release. We do not believe that these are a statistically significant part of the market.
Will you make this data open and accessible to more organisations?
Yes, we are happy to supply the data to anyone where doing so will not conflict with our mission. We encourage people to reach out to us on data@newautomotive.org.