Predicting UK BEV sales (part 2)
New Automotive UK Car Sales Prediction Review – Key Points
Crossing the Chasm?
In early December, ahead of SMMT formal statistics, we predicted that 10,500 new fully battery electric cars (BEVs) were sold in the UK in November: in fact the number was 10,345 for a remarkable 9.1% market share of all new cars sold [1]. One car in every 11 sold was a fully electric BEV.
All the more remarkable because the car market collapsed, with overall sales falling by 25% from last November due to the Covid lock-down being re-imposed.
But that didn’t stop people from continuing to buy BEVs: BEV sales were up 120% on November last year. Add in plug-in hybrid cars, and total market share of plug-in vehicles was 16%.
There you have it: one in every six new cars sold in the UK in November came with a plug.
By year-end we predict almost 100,000 BEVs will have been sold (and over 160,000 cars with a plug) in 2020. That means in 2020 one in every 10 new cars sold can now be plugged in.
16%
That one is six number is more than just an interesting data trend.
When new technologies – like BEVs, or smart-phones, or LCD TVs – take off they tend to follow a typical “S curve” shape. [2]
This happens in two phases. At first, there is a slow, almost flat-line, incremental growth, during which the new technology is bought by a few enthusiasts. This is followed by an explosive growth phase as suddenly quality and costs reduce, more people buy the product, making it yet again better and cheaper and so on.
However – all new technology faces a “chasm” in this life-cycle: whilst enthusiasts may buy it, they often only make up a small percentage of the market. Add in Early Adopters who tend to like new products you might still be only at 15% of the total demand.
The chasm exists because enthusiasts do not represent the wider market. But once a product breaches the 15% level, wider adoption can follow quickly.
Why?
As outlined in a key marketing work, Everett Rogers [3] proposed typically three reasons:
the product gets better and cheaper and offers a benefit,
it is getting widely known and talked about and seen so becomes believable, and
new companies pile in on the product and develop innovative new versions. In some cases this is also supported by a law change or government policy.
The classic chart below for consumer adoption of new technology neatly shows the cycle: it holds for many tech products.

We show the current BEV and BEV/PHEV market share based on November data on the chart in the diamond above.
That 16% of sales were plug-in vehicles perhaps suggests that EVs are at the point of crossing the chasm into main-stream adoption.
The Chasm Crossing
At NA we observe the BEV transition via two main lenses, backed up by data sources: consumer and policy.
The Consumer View
Price: BEVs are still a bit more expensive than ICE equivalents, but that margin is reducing fast as battery prices plummet, and leasing and subscription models emerge Already the 3-year ownership cost of BEVs is equal to petrol / diesel cars. From 2022 headline prices will be equal (and thereafter BEVs will be cheaper than ICE equivalents). [4]
Range / Performance: as battery prices reduce, bigger better batteries will allow far greater range of BEVs- typically 250-300 miles on a single charge. [5]
New experience: users of EVs can often charge at home or work or in parallel with other activities eg shopping. Fuelling ICE cars while fast is often a dedicated task. Soon, even charging EVs publicly will be rapid too, removing this last concern.
Purchase model: one of the reasons EV sales may have held up is because they align themselves with an on-line purchase model more easily: less legacy structures eg dealerships, and alignment with services eg low-cost home-charging deals
Policy Accelerators
2030 Ban / 2050 Net Zero: the UK government has banned the sale of new ICE cars after 2030. [6] Controversial to some, inevitable to others: in November the sales of pure petrol and diesel cars dropped to 63% market share from 84% a year earlier, and with diesel cars outsold by plug-ins. Strong signs of a major transition the government is smart to get ahead of. Analysis by the influential National Audit Office and Committee for Climate Change reinforces the speed of this transition. [7]
Health/ Emissions post Covid attention will focus on other major factors in chronic respiratory diseases – this may hasten the 2030 ban for example reducing access for ICE cars in city centres, or near schools and hospitals.
Summary:
For all the above and latest data we believe 2021 will mark the point of BEVs in the UK crossing the chasm into the mass market phase.
This means the UK will be the first large car market to make this transition, backed up by new BEV models, policy plans, new infrastructure, and a rapidly cleaning grid
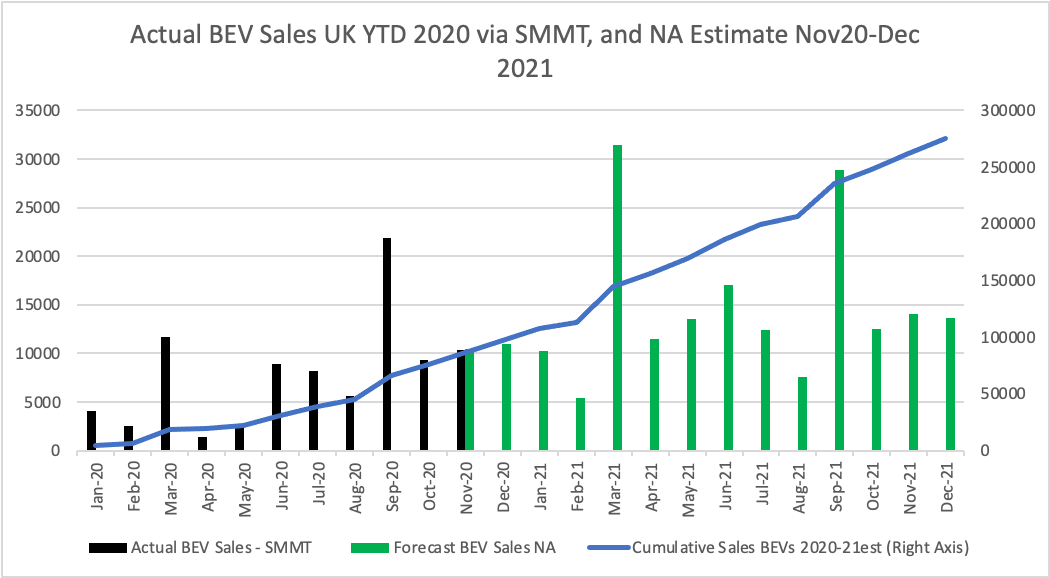
Our prediction of the next 12 months of sales is shown below – indicating over 180,000 BEV sales next year – and perhaps much higher, meaning by the end of next year, add in PHEVs, and one in every 5 cars sold in the UK could have a plug.
BEV Sales Data
[1] https://www.smmt.co.uk/vehicle-data/car-registrations/
[2] https://www.globalxetfs.com/what-does-disruptive-growth-look-like/
[3] https://en.wikipedia.org/wiki/Diffusion_of_innovations
[4] https://www.volkswagen.co.uk/offers-and-finance/finance-calculator#!/view/screen-2?annualMileage=10&periodOfMonths=48&monthlyPayment=326.32&modelId=30270&tri
mId=30270-life&derivativeId=E113MJ-2021-MAAUE2K-GP04P04-GW1RW1R-MBOW1S3&pageIndex=0&productType=SOLUTIONS&paymentBreakdown=monthly
[5] https://www.volkswagen.co.uk/electric/electric-cars/id3-1st.html
[6] https://www.gov.uk/government/news/government-takes-historic-step-towards-net-zero-with-end-of-sale-of-new-petrol-and-diesel-cars-by-2030
[7] https://www.nao.org.uk/wp-content/uploads/2020/12/Achieving-net-zero.pdf, and https://www.theccc.org.uk/wp-content/uploads/2020/12/Policies-for-the-Sixth-Carbon-Budget-and-Net-Zero.pdf